April 2022
ai2Html demo responsiveness
By Stephen Anti
This is a school project to simply demonstrate the use of ai2Html to create graphics and embed them into a webpage and to position the graphs to align side by side and also be responsive to mobile version.
In the first graph, I used a data of college students in temporary housing to create a bar graph that sits side by side of the second graphi built from a 311 Dataset on crashes in New York City.
The page also shows responsiveness.
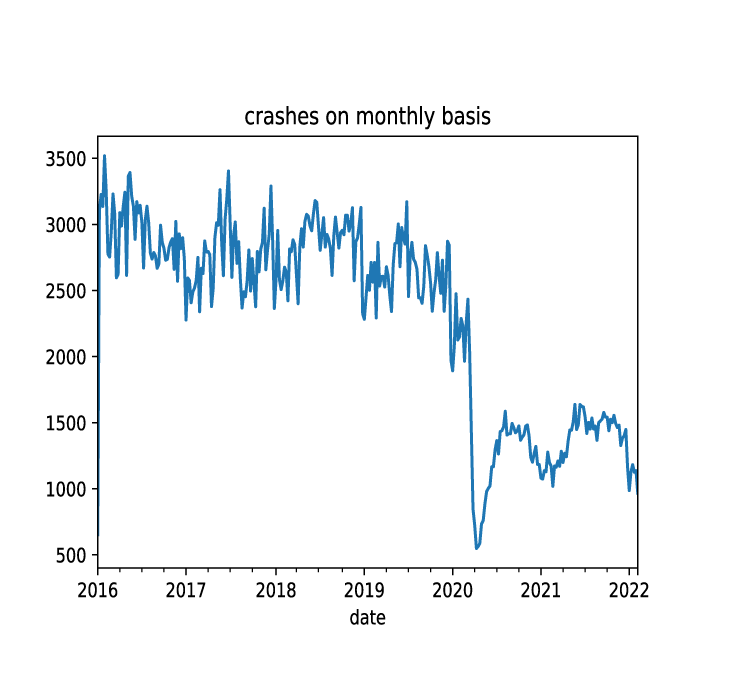
Crashes in Brooklyn
Crashes in Brooklyn, have overshadowed those of Queens, Manhattan, Bronx and Staten Island in a latest dataset of citywide crashes between 2016 and 2021.
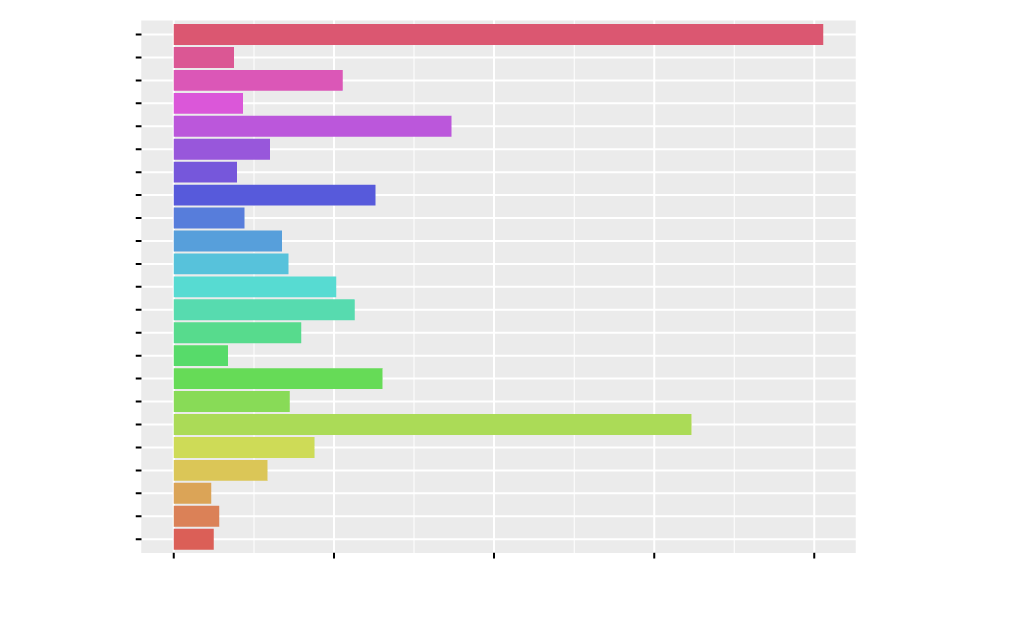
College students in temp housing
Number of college students in temporary housing on the rise, while those that are being home schooled, according to the data, has also increased across New York City. Number of students home schooled increases across New York city